OptOSS AI v.10.1 - Release
OptOSS AI v10.1 introduces new powerful AI-driven capabilities for cybersecurity operations, root cause analysis, monitoring, and operational efficiency.
.png)
OPT/NET
June 1, 2026
Large Language Models (LLMs) hold enormous promise for telecom operations, from understanding unstructured logs to automating incident response. But there’s a key challenge standing in the way: scale.
A typical Tier 1 carrier generates billions of telemetry records each month. Processing this telemetry directly with LLMs is computationally infeasible, financially unsustainable, and operationally inefficient. At enterprise pricing, even a lower-volume deployment—processing around 1 billion events per month—can exceed $200,000 in LLM API costs, even when using the most cost-efficient per-token rates. And that’s before factoring in latency, compliance, or response-time constraints.
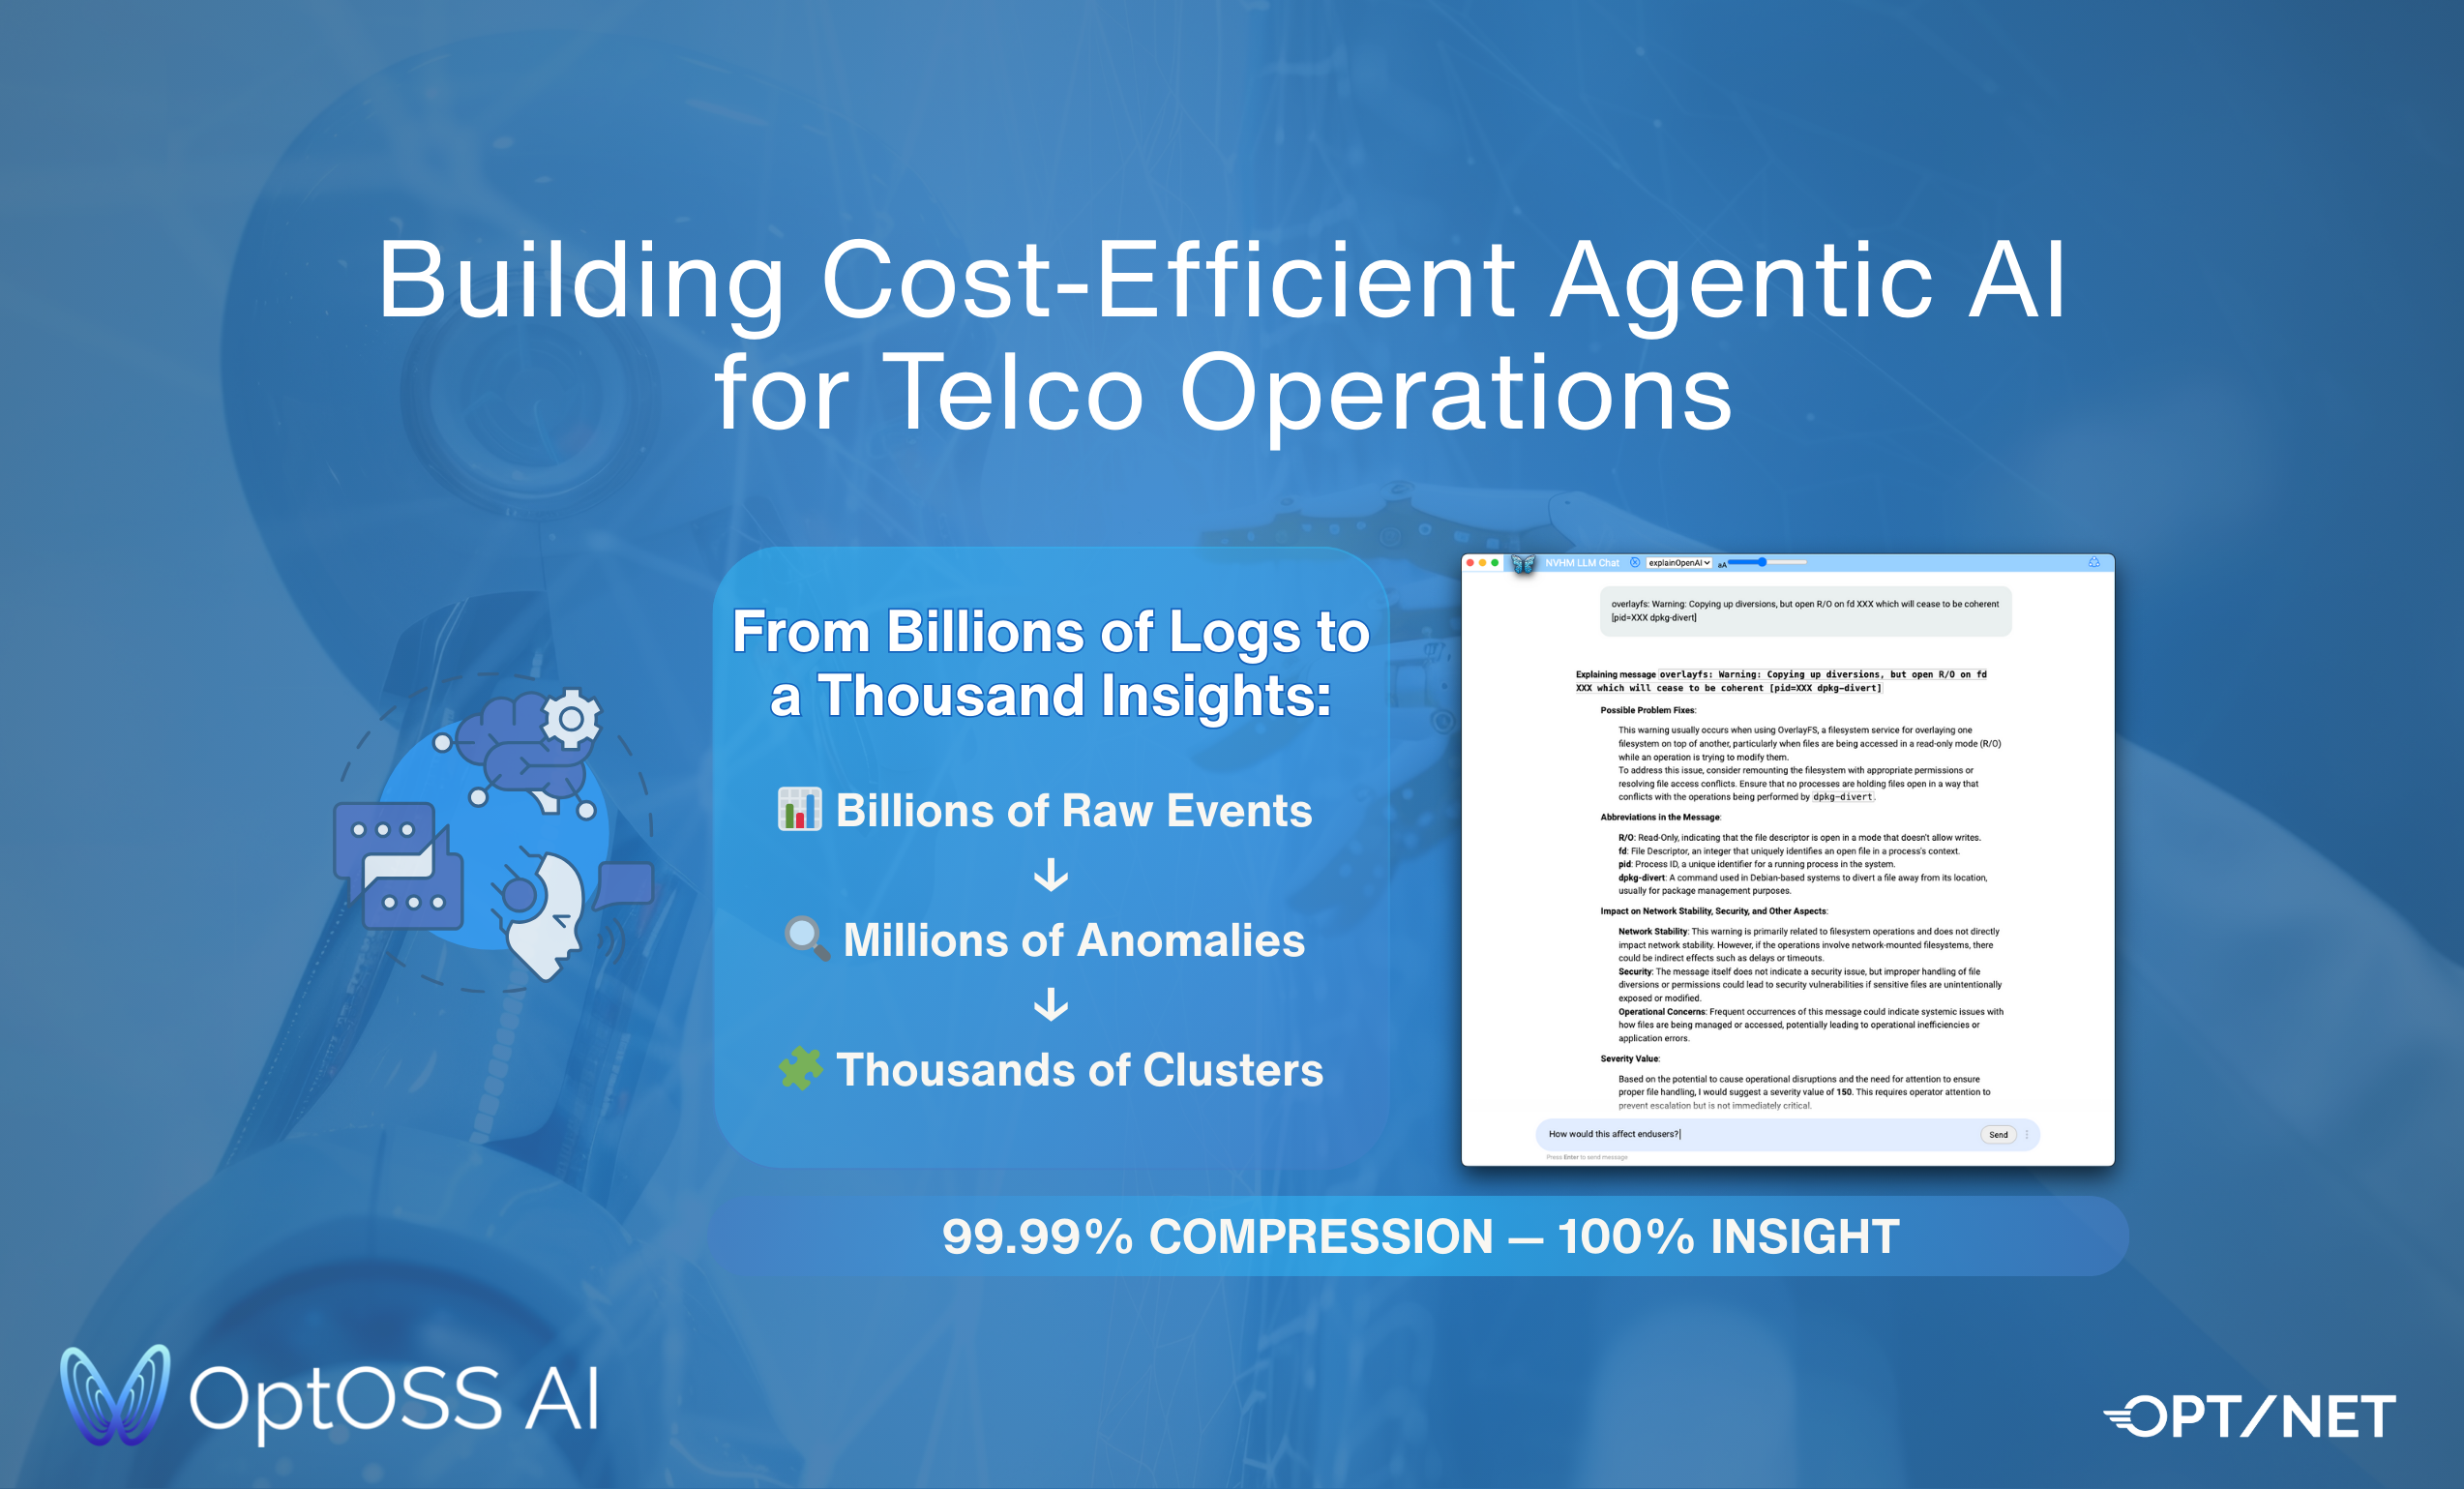
What if, instead of overwhelming LLMs with sheer volume, you used a smarter method to compress billions of events into a few thousand relevant and representative patterns?
Telecom network operators generate vast volumes of telemetry data every second. This telemetry comprises logs, performance metrics, alarms, traces, and device events, each critical for monitoring network health, diagnosing faults, and ensuring quality of service. Before deploying LLMs for analysis or automation, it’s essential to understand the scale of this data and the token costs associated with LLM consumption.
To help network operators of different sizes understand what LLM-based processing might cost, we provide two baseline models:
🟢 Conservative (“lower volume”): Represents a mid-sized or regional operator. These values reflect a reduced daily telemetry stream — closer to ~1 billion events per month. This model is useful for early adopters, testbeds, or limited-scope LLM integrations.
🔴 Full Scale: Represents a Tier-1 or nationwide operator. This model reflects the maximum telemetry generation from a production-scale deployment — over 10 billion events per month, as seen in real-world national mobile and broadband carrier networks.
Each telemetry event consists of a message or record, typically a string of characters representing JSON, key-value pairs, or log lines. The length of these events directly impacts the number of tokens generated when input into an LLM.
These averages come from sample log datasets and telecom network monitoring records. LLMs tokenize text using subword units that typically average about 4 characters per token in English text (OpenAI documentation). This is because tokens can be individual characters, common syllables, or whole words depending on frequency and encoding schemes.
Thus, the estimation of tokens from raw character counts applies a division by 4:
.png)
For example:
Why it matters: Token volume determines LLM latency, context size, and—most importantly—cost. For a Tier-1 operator processing billions of telemetry lines, this difference can easily mean millions of dollars per month in compute expenses.
This dual-baseline approach allows for flexible cost modeling across different scales of deployment, ensuring that whether you're running a city-wide pilot or managing a continent-wide network, you can estimate token usage and spend with confidence.
Once telemetry data has been converted into tokens, LLM pricing models kick in. Since token-based billing is the default across commercial LLM providers (OpenAI, Anthropic, Mistral, Cohere, etc.), understanding the token count-to-dollar pipeline is essential for any telco or IoT operator integrating AI.
In a typical telecom environment, full raw telemetry can reach 1 billion events per day (🟢) in conservative setups—and around 10 billion events (🔴) in full-scale, multi-domain deployments. These events—coming from OSS, RAN, and IoT systems—average 18–24 characters each, translating to roughly 5 billion (🟢) to 52.5 billion (🔴) tokens per day, using the standard rule of thumb that 1 token ≈ 4 characters.
When estimating LLM costs, we use two reference rates. A conservative estimate of $0.0005/token reflects pricing from Azure OpenAI, Anthropic, or other enterprise-grade providers. Meanwhile, an optimistic estimate of $0.00004/token corresponds to cost-efficient models like GPT-4 Turbo or Claude 3 Sonnet. The table illustrates just how dramatically costs can scale in production networks. If we were to process the full raw telemetry directly—1 to 10.5 billion events per day—token volumes would reach 5 to 52.5 billion tokens, translating to $200,000 to over $26 million per month, depending on the model’s cost per token. Even at the lowest token rate of $0.00004, raw ingestion quickly becomes financially unmanageable.
Sending raw telemetry straight into an LLM means paying for every character, regardless of whether it carries useful information. With billions of daily events, this method burns through budgets while drowning models in repetitive, low-value data.
Modern networks generate an overwhelming flood of telemetry — billions of log lines, metrics, and events every day. Analyzing all of this data directly with LLMs is not only computationally expensive, but also wasteful, since the vast majority of it reflects normal, repetitive behavior. It quickly becomes clear that there must be a better way to separate the signal from the noise, so that LLMs are applied to only the parts that really matter.
Anomaly detection helps cut down the sheer volume of network telemetry by automatically learning what “normal” looks like across traffic flows, device logs, and performance metrics, then surfacing only the unusual patterns. Instead of processing billions of routine data points, with anomaly detection, just the deviations from the baseline are investigated. This dramatically reduces the amount of information that needs deeper analysis.
Subsequently, Anomaly clustering takes it a step further. Rather than treating every anomaly as unique, clustering groups similar anomalies together. Many seemingly different events often point to the same underlying issue, so billions of raw data points can accurately be represented as thousands of anomaly clusters. By working with these higher-level clusters instead of every individual data point, the number of tokens required to analyze and interpret network telemetry is reduced by orders of magnitude, without losing the insights needed for root-cause analysis or automated response.
This Raw Data → Anomaly → Cluster pipeline is what makes the data manageable for LLM processing. First, anomaly detection filters down the raw data to ~1 million anomalies (🟢) from 1B events, or ~10.5 million (🔴) from 10.5B events. These are then grouped using Clustering techniques, yielding around 1,000 (🟢) to 10,000 (🔴) unique clusters.
Introducing anomaly detection changes the equation entirely. It slashes token volume by two orders of magnitude—reducing daily processing from billions to millions of tokens—bringing costs down to $2,000–$262,000 per month depending on the setup. Subsequently, by grouping similar anomalies into repeating clusters —as few as 1,000 (🟢) or up to 10,000 (🔴) clusters —we reduce token volume by up to 100 000X, with associated costs dropping to the low hundreds—or even single-digit dollars per cycle.
This tiered application of LLMs along with other more computationally efficient techniques is essential for production deployments. Without anomaly detection and clustering, using LLMs for real-time telecom data remains prohibitively expensive. With them, automated root-cause analysis at scale becomes both powerful and economically viable.
Intelligent automation starts with a critical principle: don’t overload LLMs with low-value data. To make LLMs viable for real-time operations, it’s essential to reduce the volume of input to only the most relevant and actionable insights — then route those to the appropriate processing tier. OptOSS AI achieves this through a streaming architecture that combines unsupervised anomaly detection, sliding-window clustering, and a tiered Agentic AI layer.
Once you've condensed billions of raw telemetry data points to a handful of meaningful clusters, a new challenge emerges: how to act on them — fast, intelligently, and affordably. Simply flagging an issue isn’t enough. In the world of always-on 5G, hybrid cloud, and multi-vendor orchestration, telecom networks need systems that not only detect and interpret incidents, but also take action. This is where Agentic AI enters the architecture.
Rather than sending raw telemetry into LLMs, OptOSS AI first applies streaming anomaly detection to live telemetry — filtering out the normal, known, and repetitive. Incoming logs and metrics are continuously monitored for unexpected changes. Detected anomalies are passed into an on-premise patented streaming clustering algorithm that groups anomalies into a manageable set of repeating behaviours.
The first stage applies unsupervised models to detect unexpected or unusual patterns in logs, metrics, and traces. These techniques require no labelled training data and are device + vendor agnostic. Next, anomalies are grouped into semantically similar patterns using a streaming clustering engine:
Each cluster retains rich metadata, including:
Only the cluster information is passed forward to the LLM of your choice, slashing token usage by over 99.99%, while retaining semantic and operational context. By combining streaming anomaly detection, intelligent clustering, multi-tiered model routing, and agentic wrappers, OptOSS AI delivers real-time operational intelligence helping you reach level 5 autonomous network operations (as defined by TM Forum).
Once a new cluster is formed, OptOSS AI hands them off to its GenAI Advisor module — one of the industry’s first telecom production-ready LLM components. It leverages Gen AI to explain anomaly clusters to Operators in layman’s terms, details possible causes, and even proposes remediation actions — all in real time and aligned with telecom-specific semantics.
Key features of the OptOSS GenAI LLM module include:
Whether working online with dynamic LLMs or offline via a managed service model, OptOSS AI empowers engineers with intelligent, contextualised, and explainable outputs — not just alerts.
By combining real-time anomaly detection, clustering, and a tiered agentic LLM engine, OptOSS AI delivers scalable AI for live telecom environments — without breaking your budget!
Curious how it performs in live telecom deployments?
.png)

