We are excited to announce the new release of MONITORED AI®. This major release, version 10.0, introduces a new authentication flow, metrics service integration, and multiple usability improvements designed to enhance platform accessibility, improve monitoring capabilities, and streamline day-to-day workflows for users and developers.
🚀 What's New
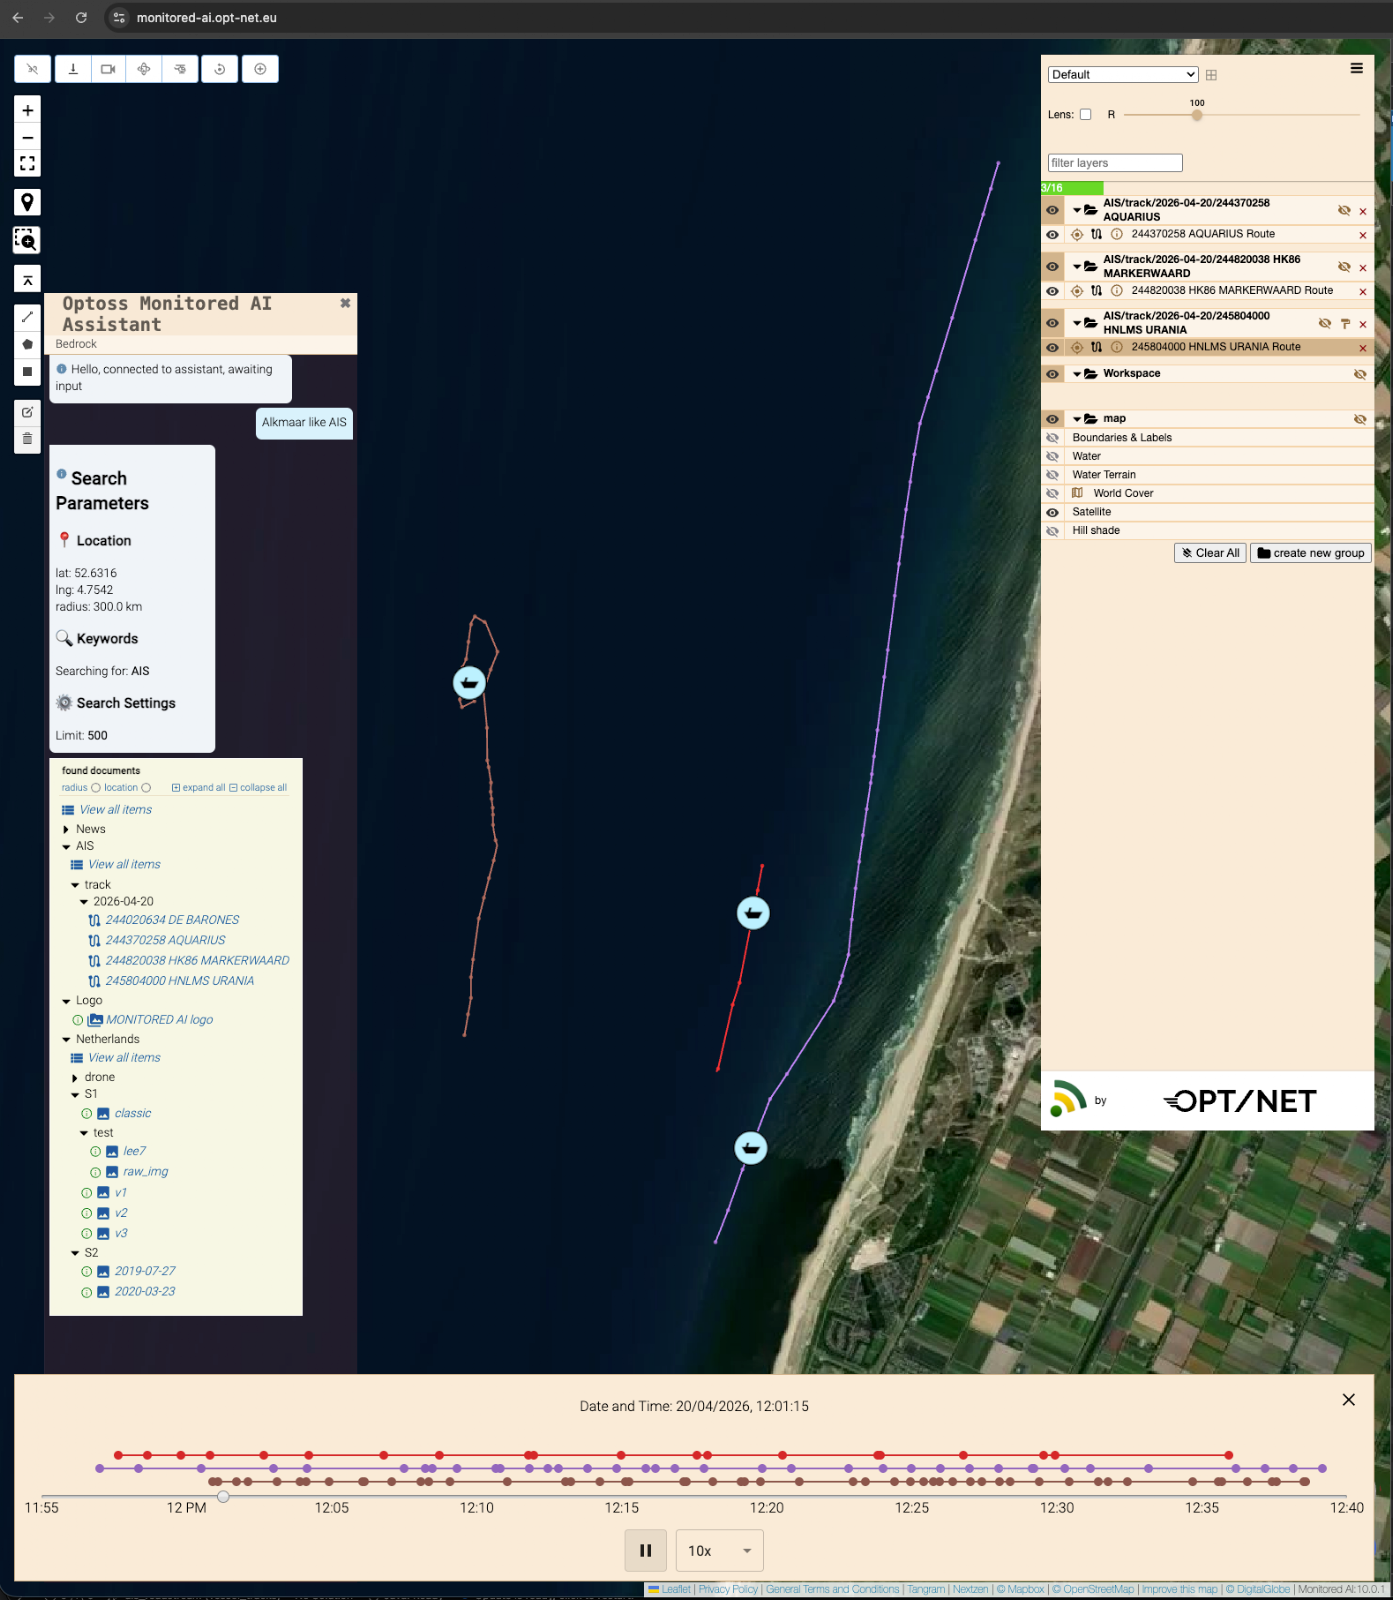
1. Track Player — Visualise and Animate Time Tracks
A new Track Player feature allows users to visualise and animate time-based tracks directly on the map. Each track is represented as a vector line with time-labeled vertices and can be controlled via an interactive playback timeline.
New document type: Track — each track corresponds to a layer on the map.
Interactive playback: Drag the current time position or play tracks automatically with selectable interpolation speed (real-time, x10, x100).
Multiple tracks: When several tracks are selected, the timeline covers all tracks from earliest start to latest end.
Track state visualisation: Objects appear gray and inactive if the player time is before the track start or after the track end.
Track management: Tracks can be added or removed from the player via a dedicated “track icon” in the layer control; the player automatically appears or hides depending on track selection.
Timeline display: Tracks are presented on the timeline according to their start times, with animation showing object positions along the track as time progresses.
This feature is ideal for analysing movement data, GPS tracks, and time series trajectories.
2. Local Finder
The Local Finder service enables users to easily search, discover, and navigate through the GIS products stored in the Shared Tenant Data Folder. It supports multiple input data types including ROI, Reference Models, Satellite Products, and Vector data. It can be accessed via the custom OCLI Finder or directly through the Admin Portal.
3. Batch Processing Enhancement (Mediator AIKP)
An example module, Mediator AIKP, has been published in OCLI Open Source. This module demonstrates how to orchestrate and execute other modules within the system, acting as a coordination layer for managing processing flows. It serves as a reference implementation for AIKP developers, showing how individual components can be combined into structured workflows.
Using this approach, developers can create dynamic batch-processing scenarios through modular composition and runtime coordination, enabling flexible execution of multi-step analytical pipelines and improved automation across the platform.
4. DevSecOps CI/CD
The platform now supports an enhanced DevSecOps CI/CD approach, enabling fast, automated, and secure delivery of releases across multiple tenant deployments. This streamlines the deployment pipeline, reduces manual intervention, and ensures consistent rollout of new versions across environments.
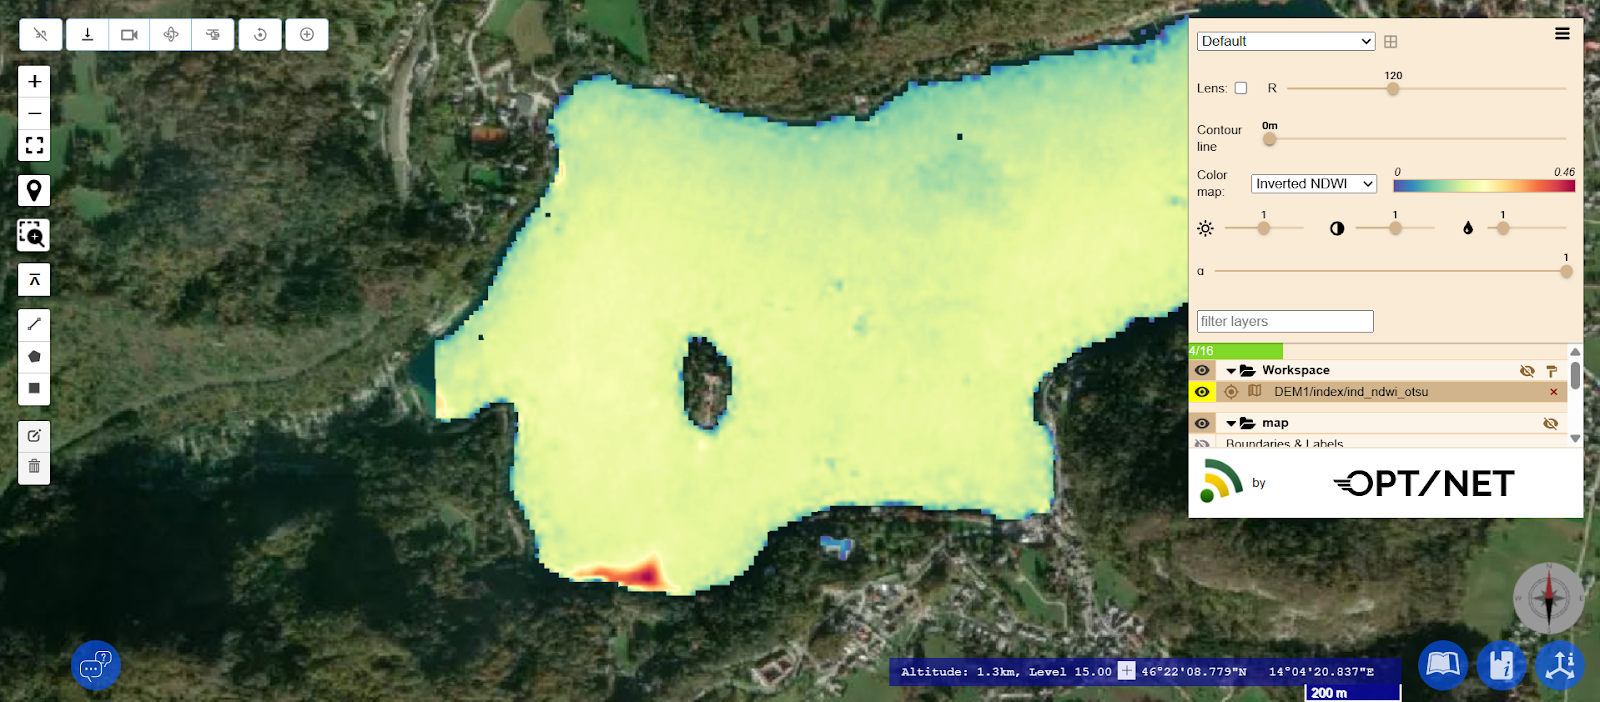
5. New AIKP modules
Dynamic adaptive image binarisation (Otsu-based)
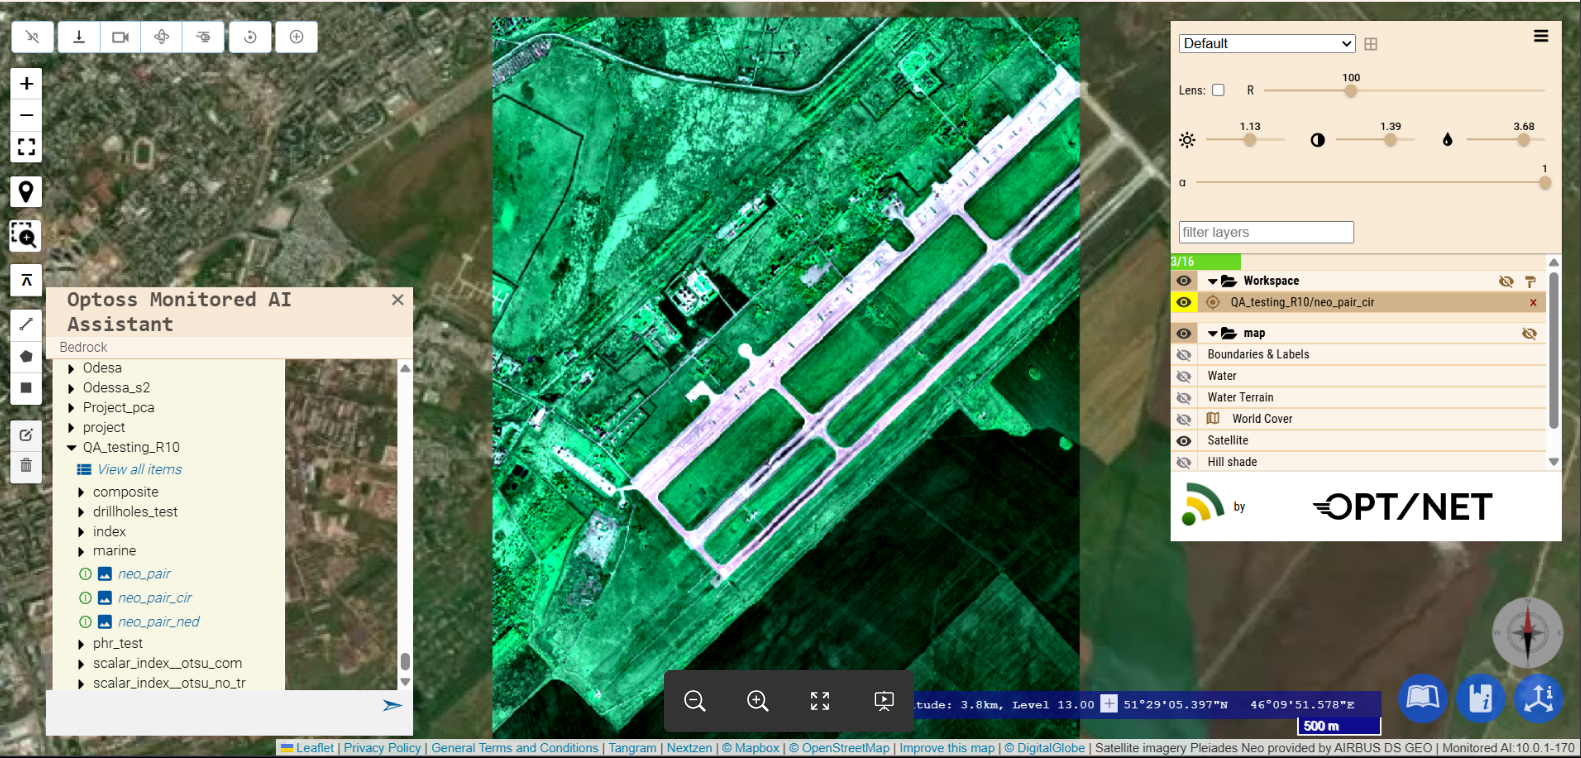
This new AIKP creates a single-channel image using predefined band arithmetic expressions. This allows the process to be automated. A key feature of this AIKP is its implementation of the Otsu algorithm for dynamic, adaptive image binarisation, which automates target object detection.
The system adapts to varying lighting conditions, sensor angles and contrast levels of the selected location by calculating the threshold for each specific scene. This enables target objects (e.g. water, snow or burnt areas) to be automatically distinguished from the background.
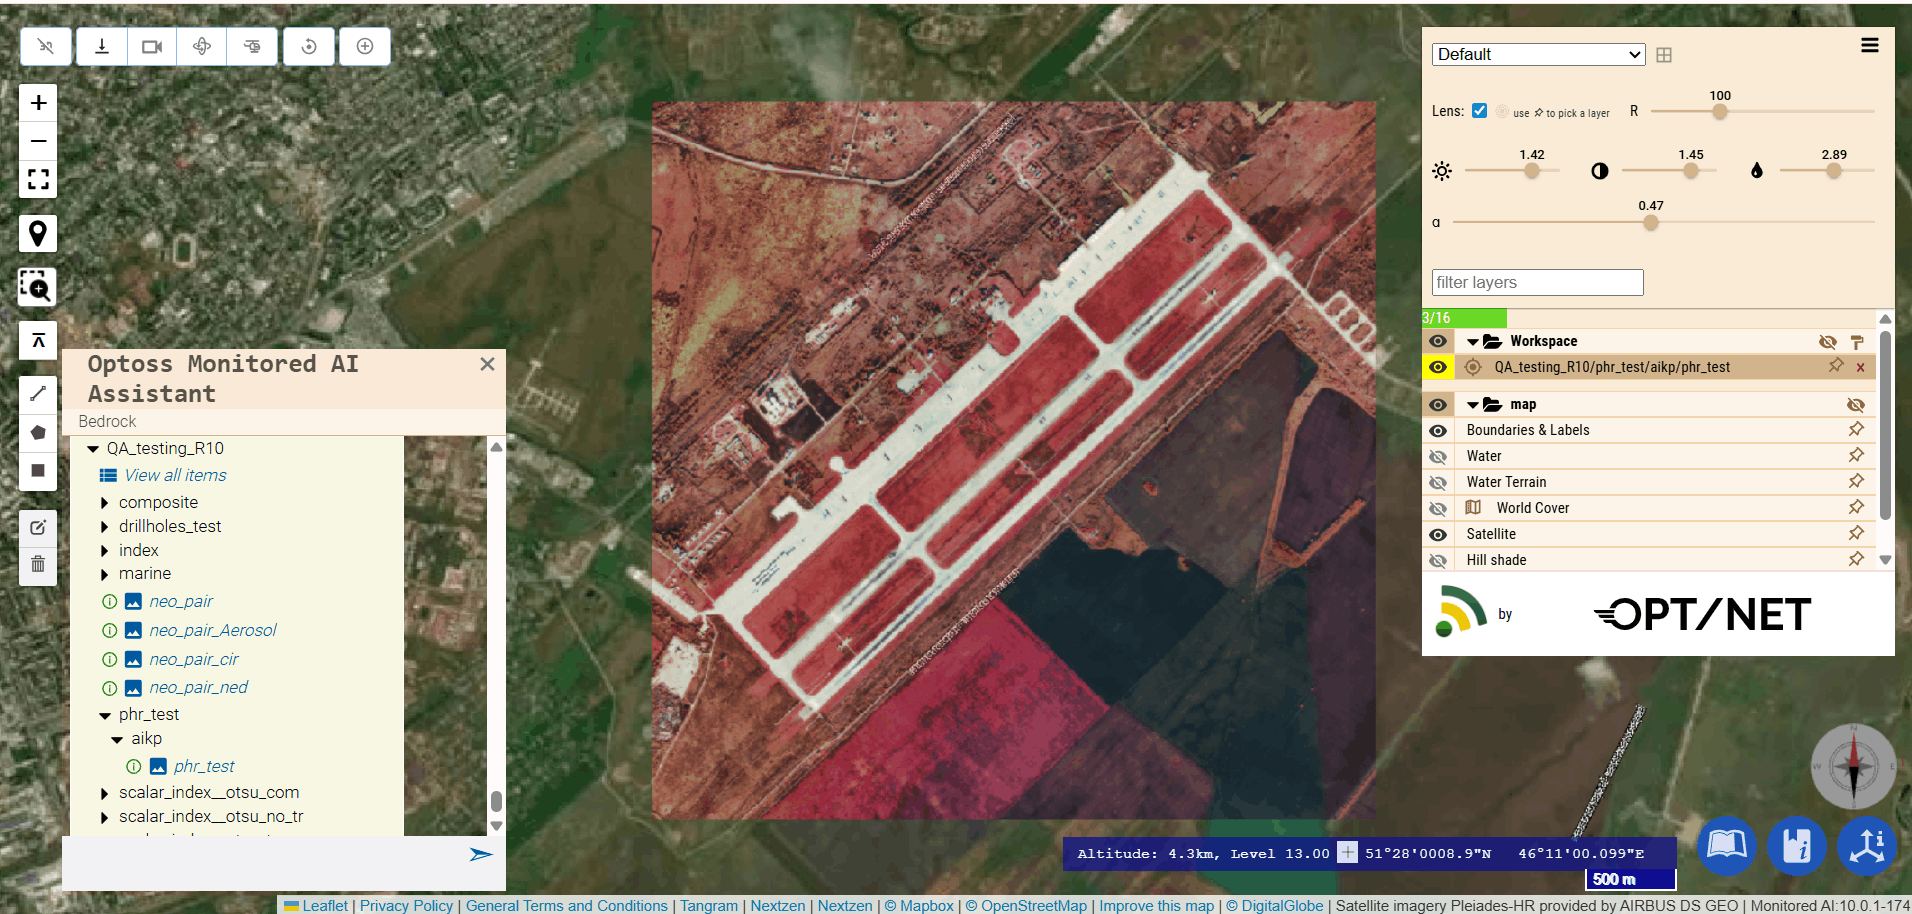
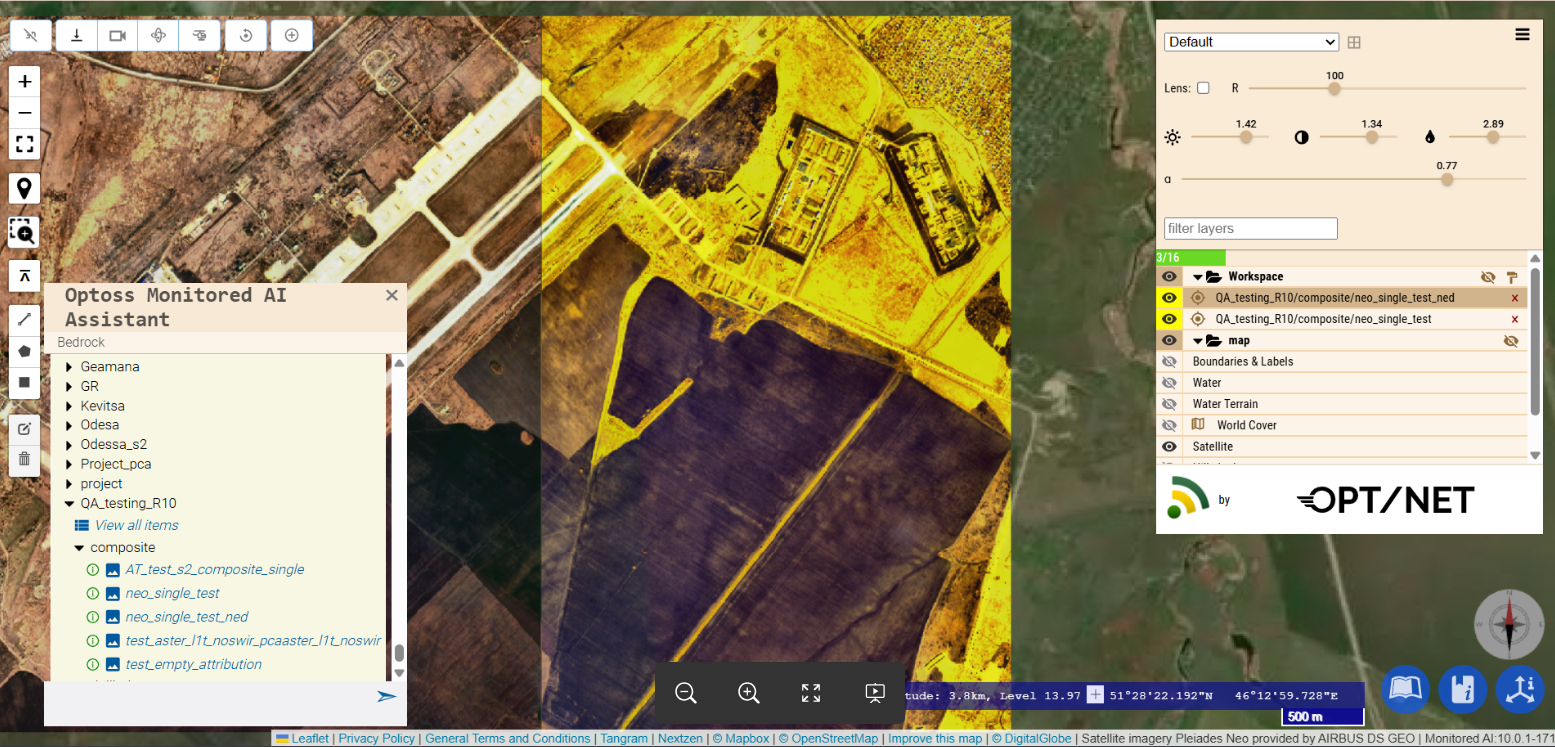
New AIKP modules have been added to support processing of Pléiades (PHR) and Pléiades Neo imagery, including composite pair, composite single, and PHR single configurations.
These additions enable more flexible handling of different image acquisition modes and improve the quality and consistency of generated outputs. The modules support efficient preprocessing of high-resolution satellite imagery, facilitating downstream analytical workflows.
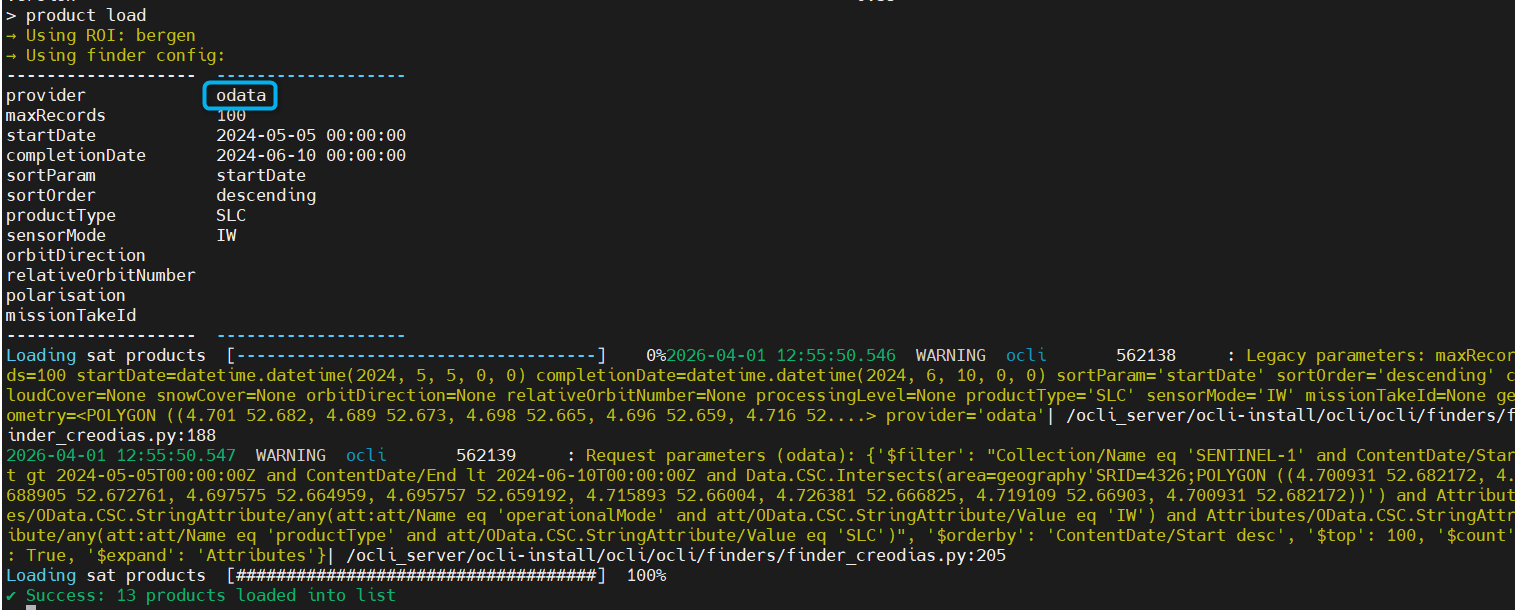
OData API support has been added to the CREODIAS OCLI Finder. It enables more reliable querying, filtering, and data retrieval across datasets. This improves performance and stability, making operational workflows faster and more efficient.
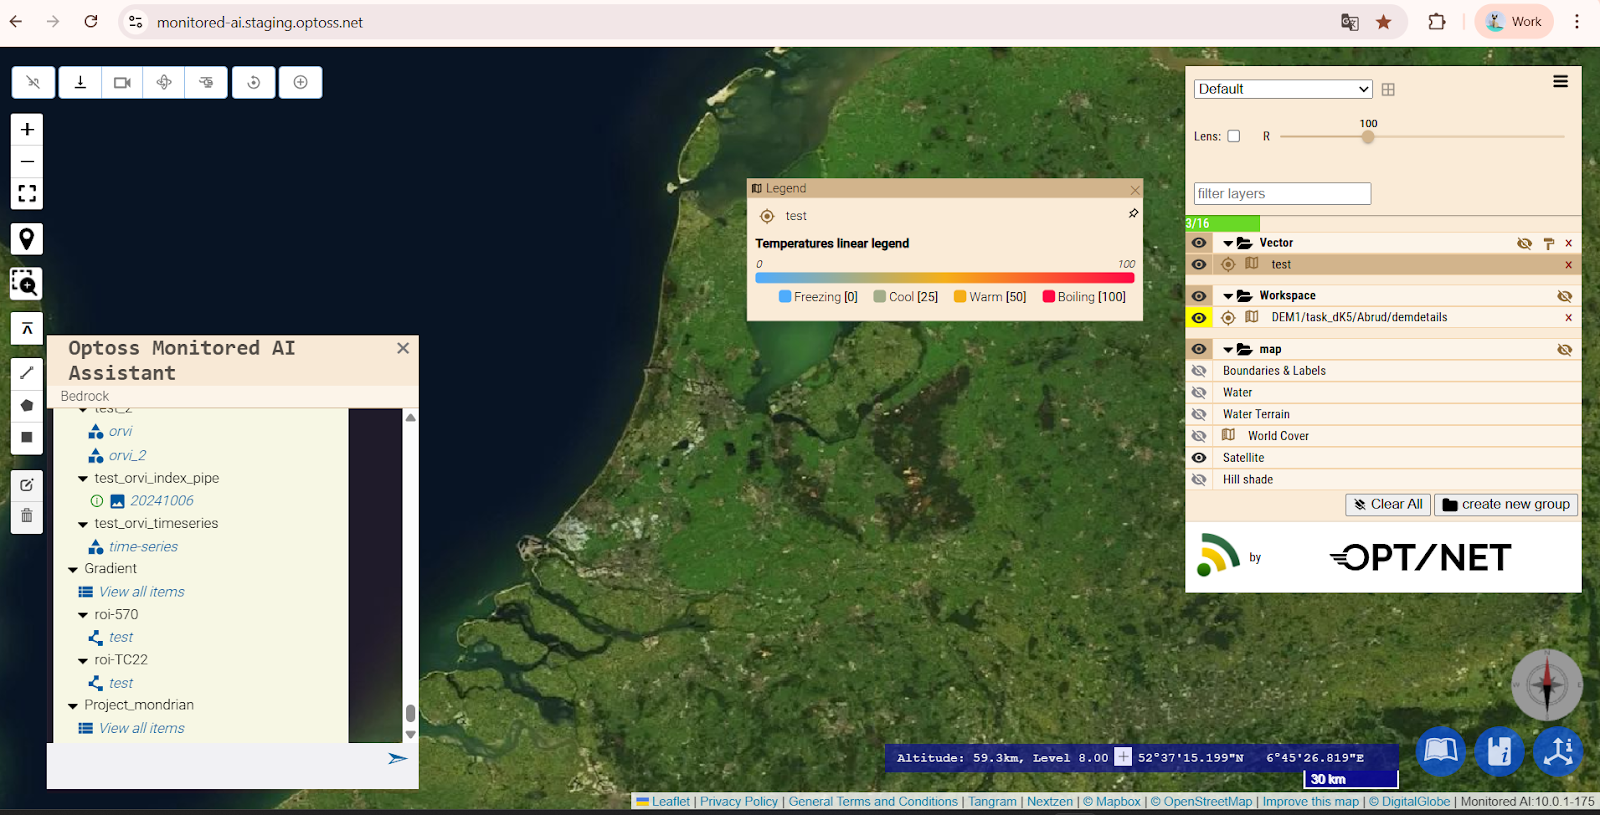
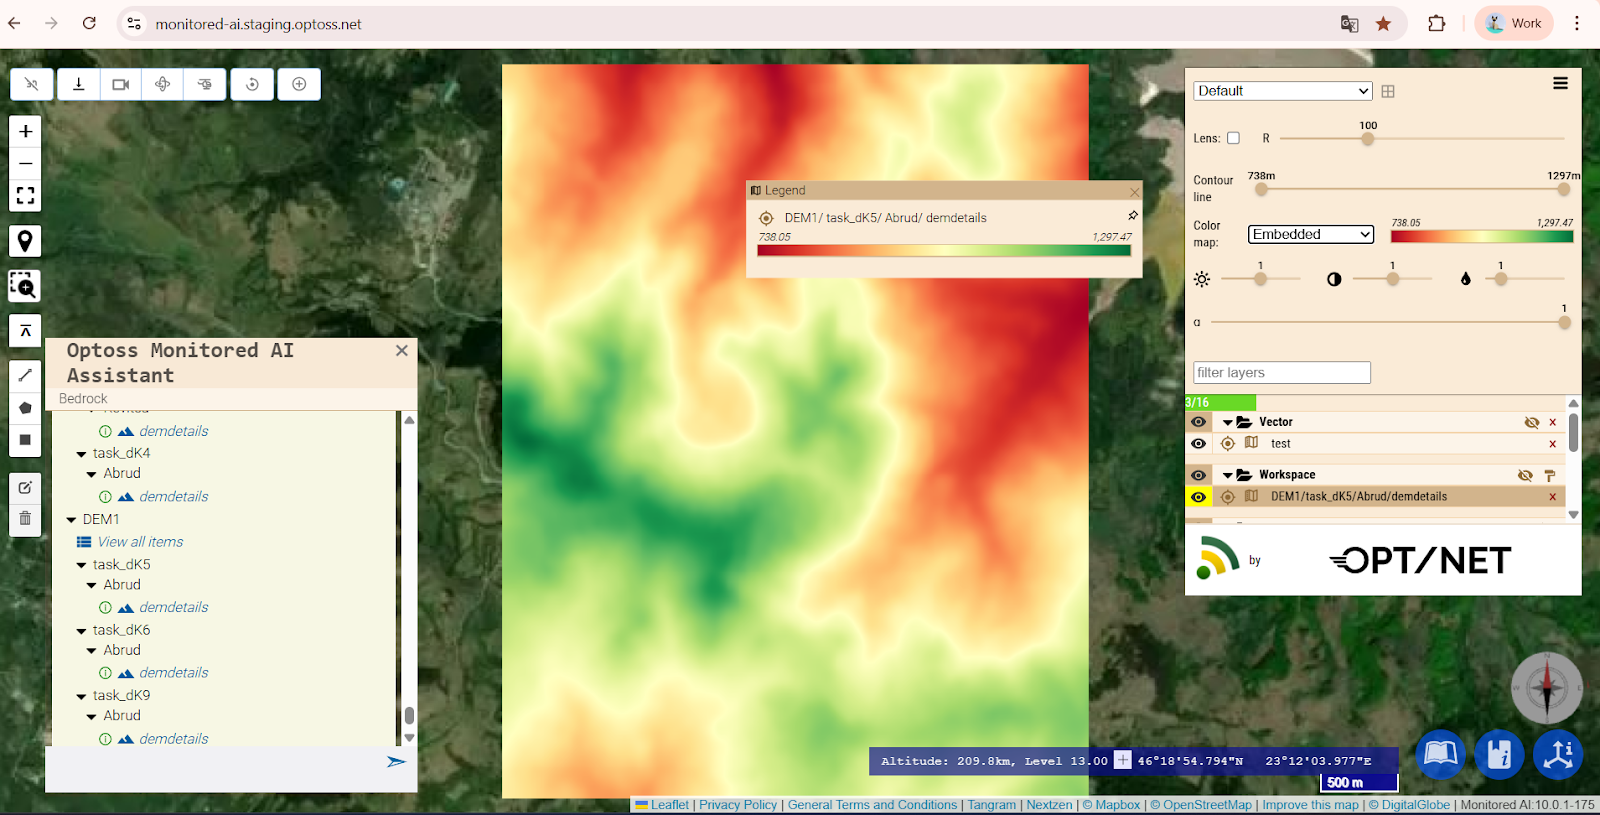
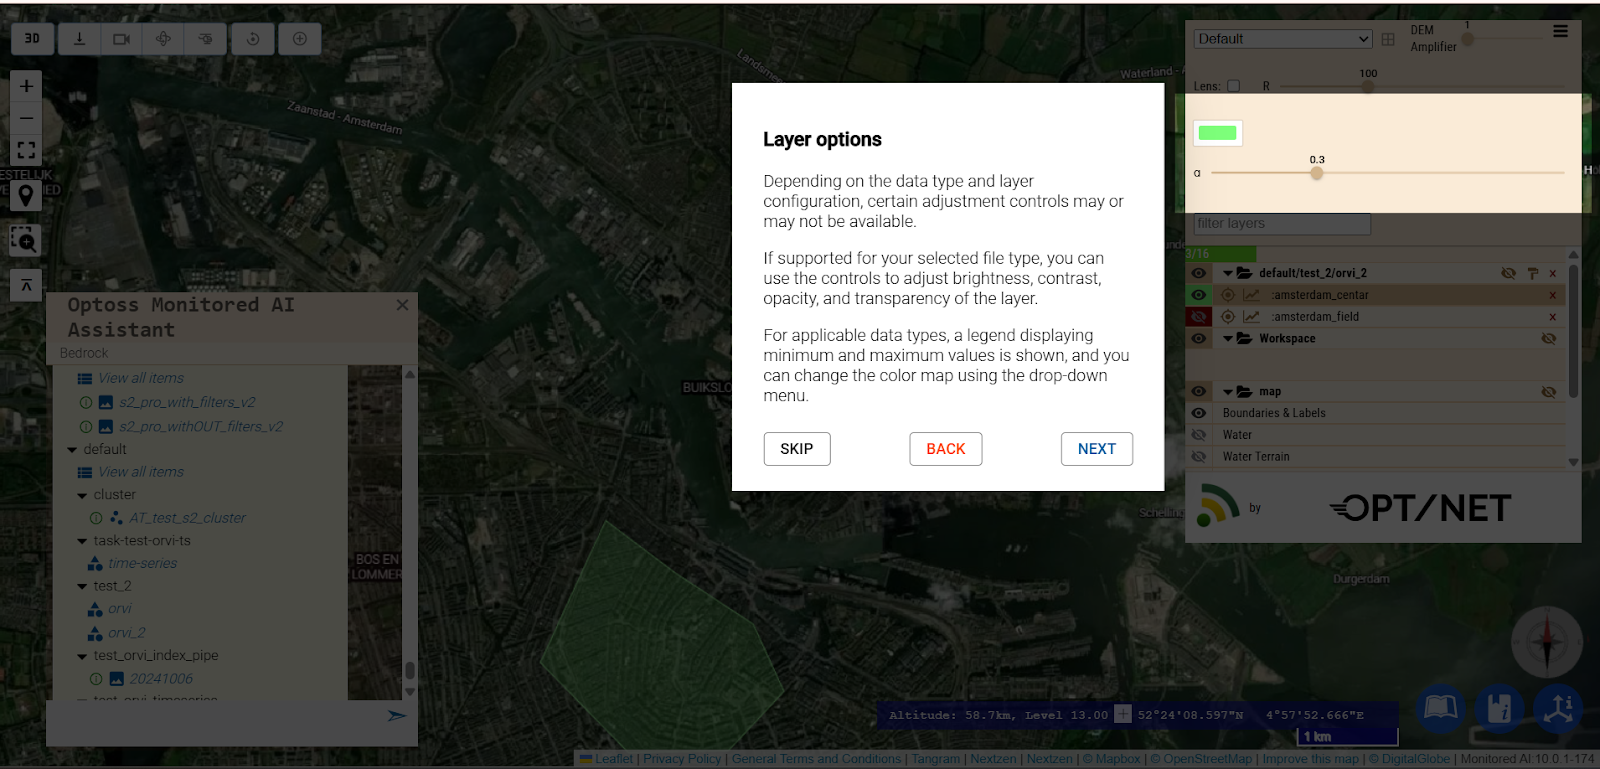
Custom legends (image, discrete, or gradient) can now be attached to any published product type. The platform supports both auto-generated and custom legends, providing flexible visualisation options for different datasets and outputs.
Custom legends can be attached to any document or layer and define how values are represented. They can be provided either as a structured color list or as a static image, allowing tailored visual interpretation for specific use cases.
Auto-generated legends in OCLI UI documents (DEM, DEMStack, Scalar, and Actor) are derived directly from band and colormap metadata rather than defined as standalone objects. This mirrors the MONITORED AI schema and ensures legends are generated from pipeline outputs without duplicating rendering logic.
The Finder now allows filtering of images based on how well they fit into the Region of Interest (ROI). This ensures that users can easily select products that fully cover the target area.
When multiple image tiles overlap a ROI, the Finder can automatically prioritise or select the best-fit tile. Users can also set a minimum fit threshold or require full fit to filter results, ensuring accurate and complete data selection for downstream analysis.
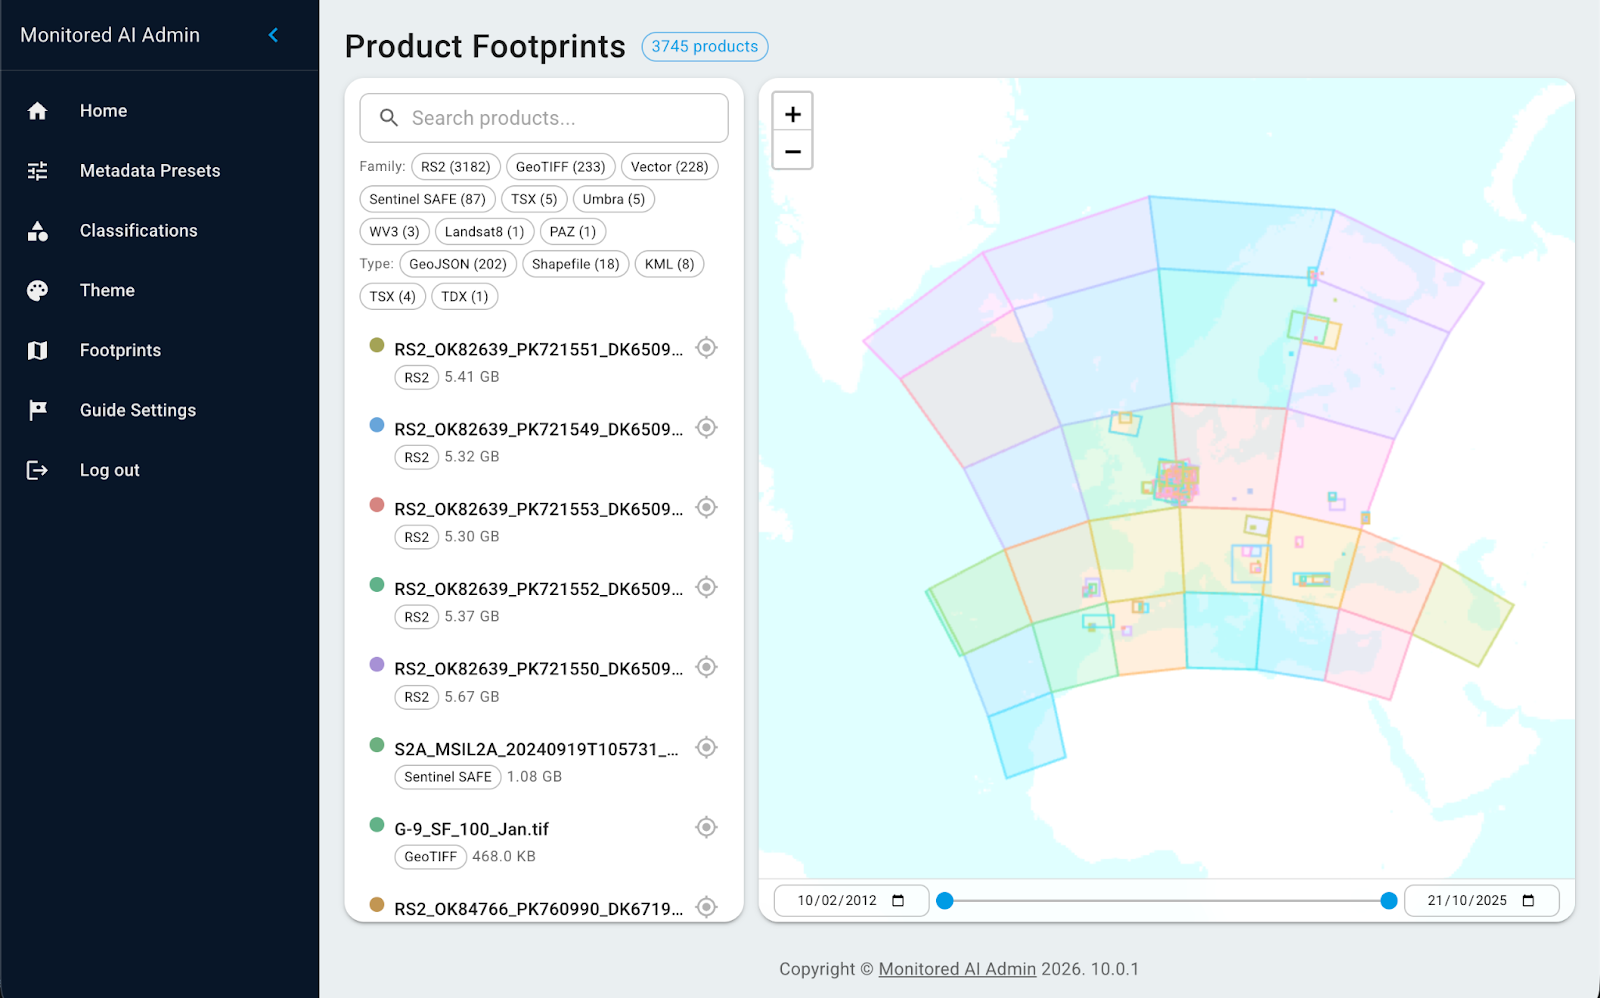
3. Admin Map Exploration for Shared Documents
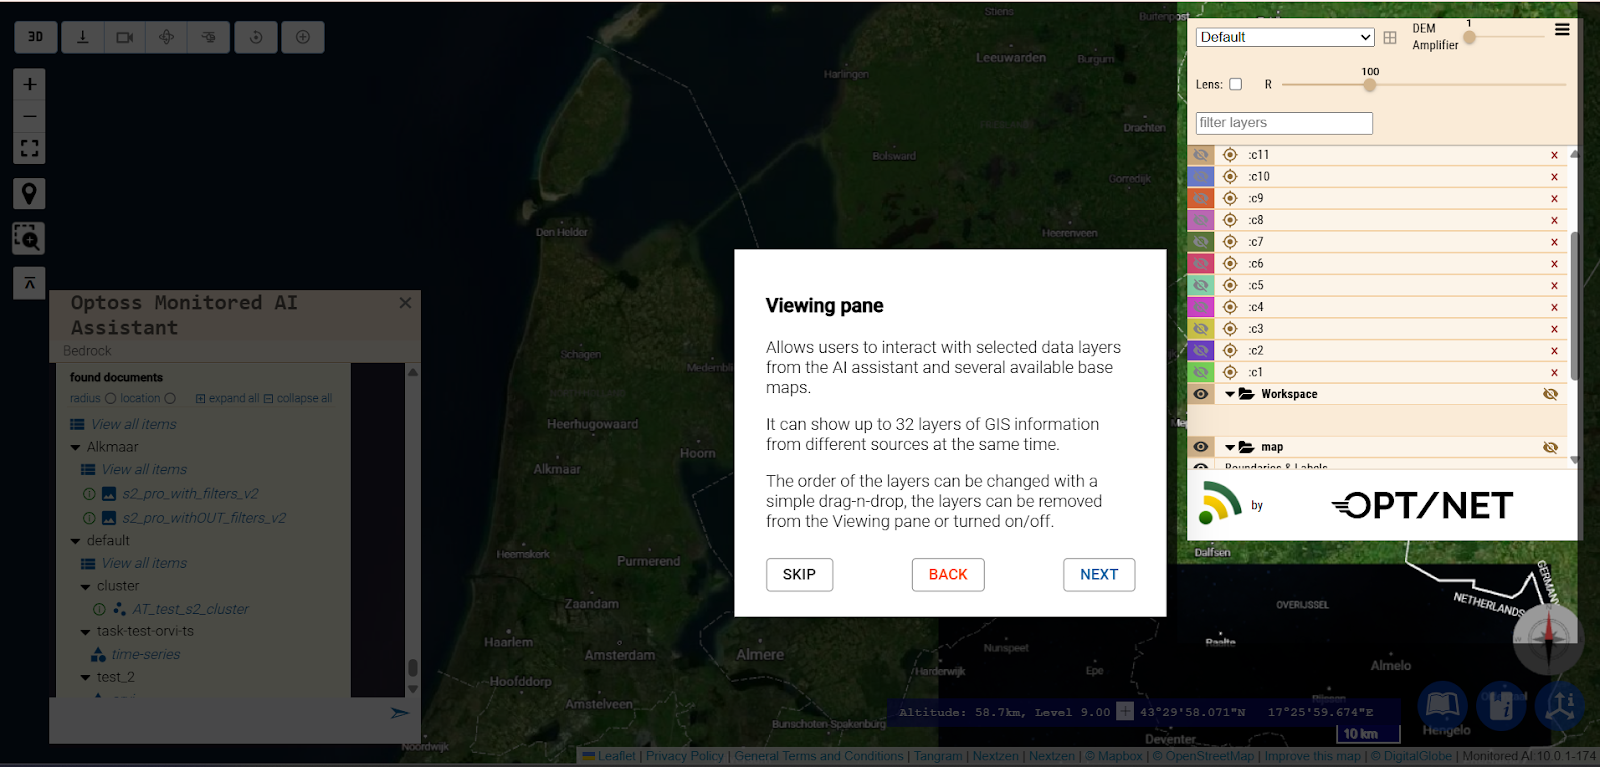
In this release, admin users can explore published documents and products from the Shared Folder directly on a map. This feature allows users to visualise the geographic location of existing documents, quickly see which regions are covered, and interact with spatial data more intuitively.
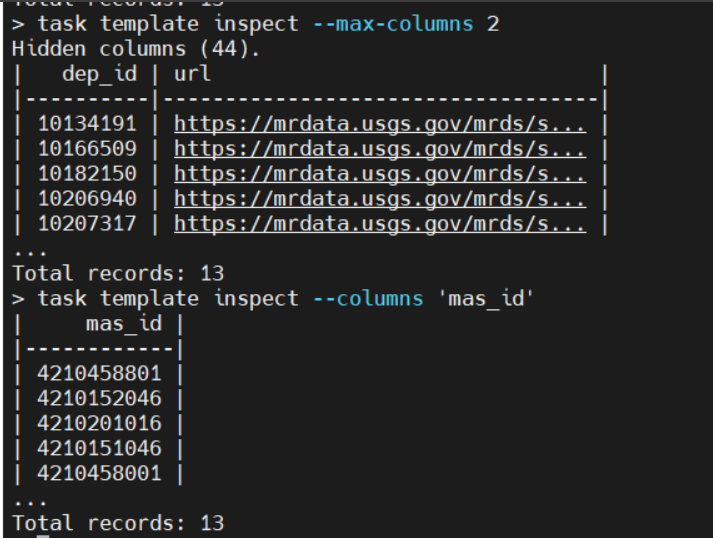
The OCLI AIKP Vector Basic interface now makes exploring large datasets easier and more intuitive, allowing users to better explore input documents. Tables display a limited number of columns per page, with optional paging to view additional columns, and users can select which columns to display or list all available columns. These improvements make table outputs clearer and more manageable, helping users quickly focus on relevant data.
Example of table display and operation:
Command task template inspect gives as a result a table form of 6 columns on one page. User /enter/tab/space/action shows next 6 columns and so on until end.
In addition to the features listed above, this release includes multiple stability improvements, performance optimisations, and issue corrections across the platform.
.png)

.png)

